LINKED THE PINK
- Harsh Shah
- Nov 19, 2022
- 2 min read
The elective “ Network Literacy” aimed at understanding networking through a dataset .The course started with seeing examples where network theory is used in urbanism and architecture. We were then introduced to the structure and the evolution of the networks behind each system and the common set of fundamental laws and principles which drives it.
We learned two basic network parameters :Number of nodes and Number of links where number of nodes represent the number of components in a system while number of links represent the total number of interactions between the nodes.We understood how these components interact with one another and hence constitute the network system .Further ahead, we could understand any network if these parameters were defined and hence get an overall understanding about that complex system.We learned how to represent a network as a graph by learning the “graph theory “.To narrow it down, in the course we were mainly introduced to networks in architecture and urbanism which would be actually helpful to us in our future projects.
We further were exploring the data analysis for urbanism by creating a data science project. To begin the process of our projects we asked a research question responding to the city. We were given a set of ideas on the project which we could anchor to or have an open project with a different topic.
NETWORK/RESEARCH QUESTION:
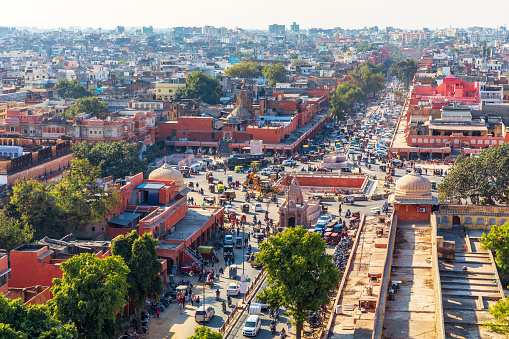
Understanding the accessibility and connectivity of the City Palace from the 8 gates of the Pink City of Jaipur. This resulted in asking the question that what is the complexity in the spatial configuration of the Pink City. Also understanding whether is there a hierarchy in the way space is organised or no?
PROCESS AND DATA
We collected data from various data sources and curated them into a refined data set.
Data Source-
Open street maps :To understand the overall geography of Pink City.
Jaipur Heritage :Data of the occupation and streets including bazaars.
Unesco Heritage: Understanding the gates and chaupars of Pink City.
Data Set-

NETWORKS

Connectivity and geo-locating the nodes to understand how spaces are linked.

The accessibility of the fort bringing out the hierarchy in the spatial configuration.
CONCLUSION
We looked at the planned area of Jaipur- (Pink City) and mapped it using network science in the abstract form.Based on the analysis, we identified :
The nodes with high number of walks and a greater degree centrality are primarily the 'Bazaars'.
When one has to go from the Gate to the City palace,he has to pass through the
1.Baazar
2.Chaupar
3.Raasta
Degree of city palace is not so high while bazaars have very high centrality measure(you need to go through bazars in order to get to the other nodes of the city) .
This means that the Bazaar has really high 'Betweenness centrality'.
Bipartite network form between Bazaar and other locations of the gates, chaupars and the palace because the baazar is not connected to other bazaar’s(exception of one bazaar) but are connected to other classes(where nodes in one group are connected only with nodes from other types).
Hence, an abstract representation of the landscape helped us identify the hierarchy and hence one identifies the level of importance of the different nodes.
IN COLLABRATION WITH ANIKA PUGALIA


Comments